SAW-ST-V8 User Manual V1.0
SAW-ST-V8 User Manual V1.0
1. Product information
1.1 Description
Specifically designed for Stereo-seq sequencing data, SAW is a spatiotemporal bioinformatics software suite. It supports the space-time dimension by restoring the Coordinate ID (CID) and expression level of each Molecular ID (MID) in the sample tissue. Extract high-density and significant biological information from massive datasets.
Now SAW allows analysts to map the transcriptome in formalin-fixed paraffin-embedded (FFPE) and fresh frozen (FF) tissue samples, for more exploratory research regarding normal development, disease pathology, and clinical translation.
1.2 Attention
Only fit with StereoMap version: >=4.0.
The version correspondence between SAW-ST-V8 and offline software:
| Online version | Offline version |
|---|---|
| 1.0.1 | 8.0.2 |
| 1.0.0 | 8.0.1 |
1.3 Related workflow
● SAW-ST-V8-makeRef: prepare index files of the reference data.
● SAW-ST-V8-checkGTF: check the annotation file format.
● SAW-ST-V8-realign: restart analysis with manually processed files.
● SAW-ST-V8-clustering, SAW-ST-V8-reanalyze-lasso, SAW-ST-V8-diffexp: perform secondary analysis.
● SAW-ST-V8-gef2gem, SAW-ST-V8-gem2gef, SAW-ST-V8-bin2cell, SAW-ST-V8-visualization, SAW-ST-V8-tar2img, SAW-ST-V8-img2ipr and SAW-ST-V8-merge : support file format conversions.
2. Product Introduction
2.1 SAW-ST-V8
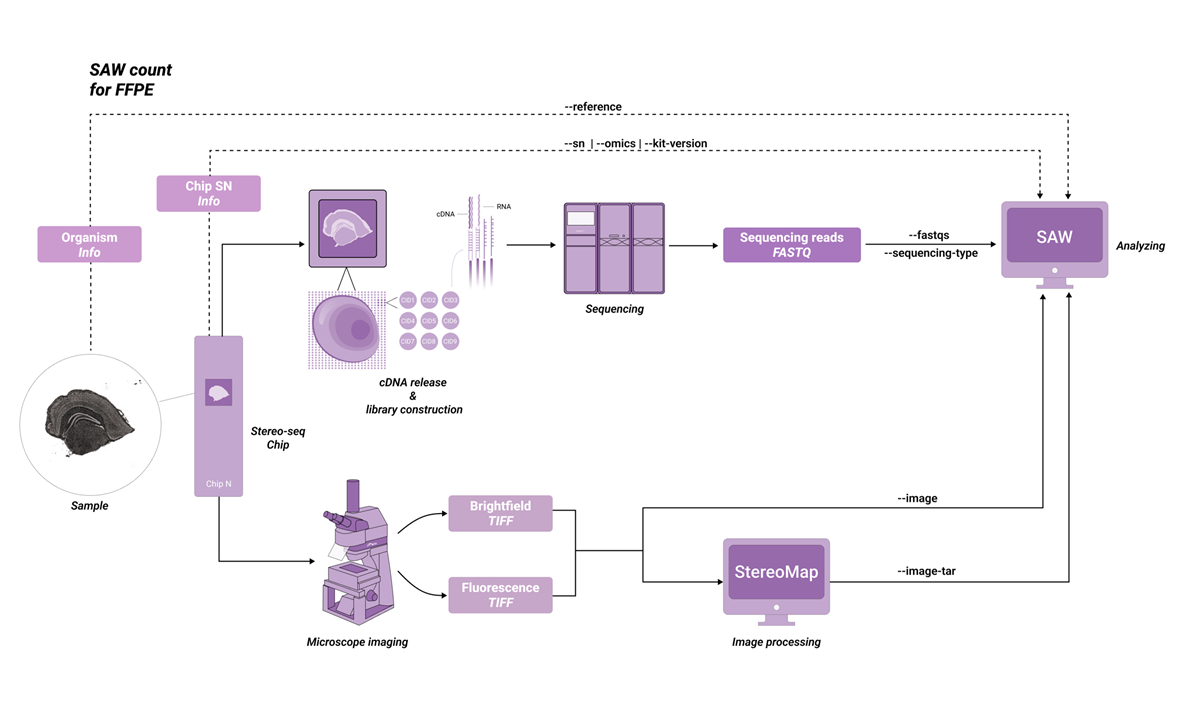
The SAW-ST-V8 main process will complete the count step, SAW count is a central component of the software suite, compatible with most Stereo-seq FF and Stereo-seq FFPE datasets. The inputs consist of a chip mask, FASTQ files, a reference, and a microscope image. So that the pipeline counts gene expression reads to generate expression matrices and analysis results from the Stereo-seq chip.
Depending on the STOmics family of products, the parameters are used slightly differently. Before analyzing with SAW count, please note the information about your kit version and select the appropriate version (Table 2-1).
| SAW-ST-V8 v1.0.1 | KitVersion |
|---|---|
| FF | Stereo-seq T FF V1.2 |
| FFPE | Stereo-seq N FFPE V1.0 |

3. User Manual
The SAW-ST-V8 standard analysis process is managed in the whole process of sample input and report output through the DCS Cloud. The following introduction of the operation guide is based on DCS Cloud.
3.1 SAW-ST-V8 ReferenceIndex
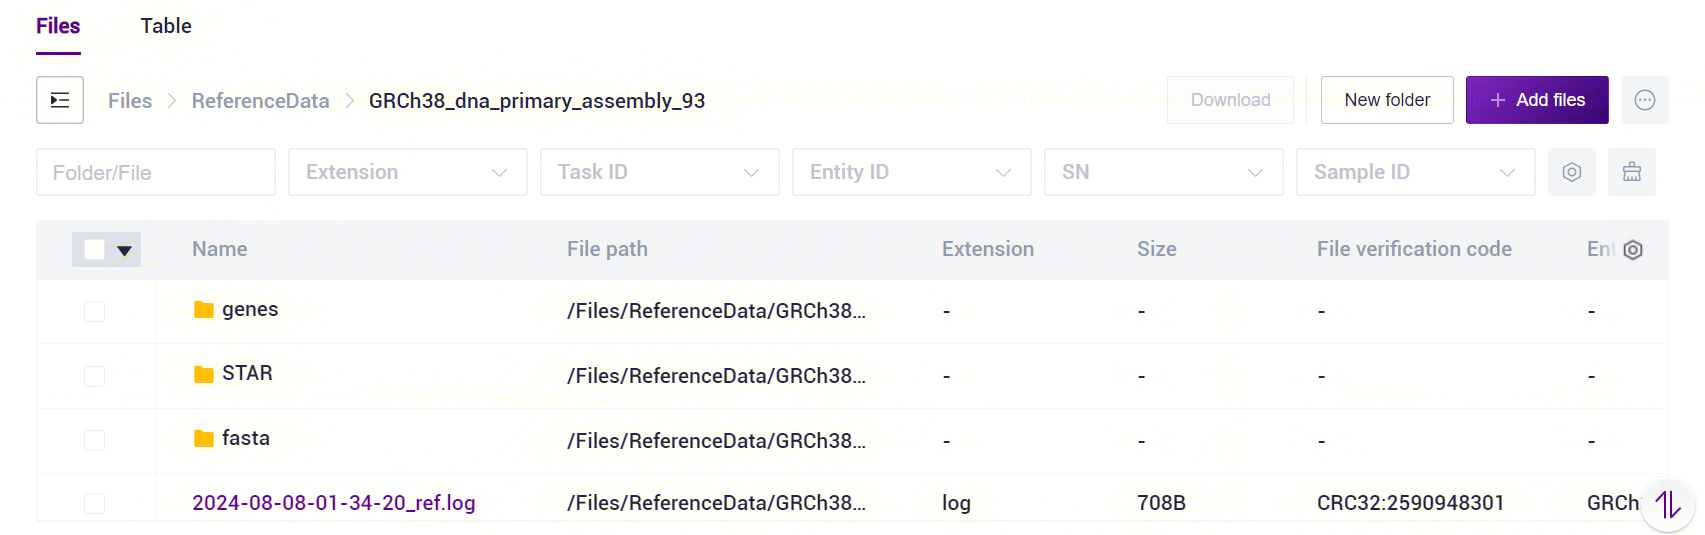
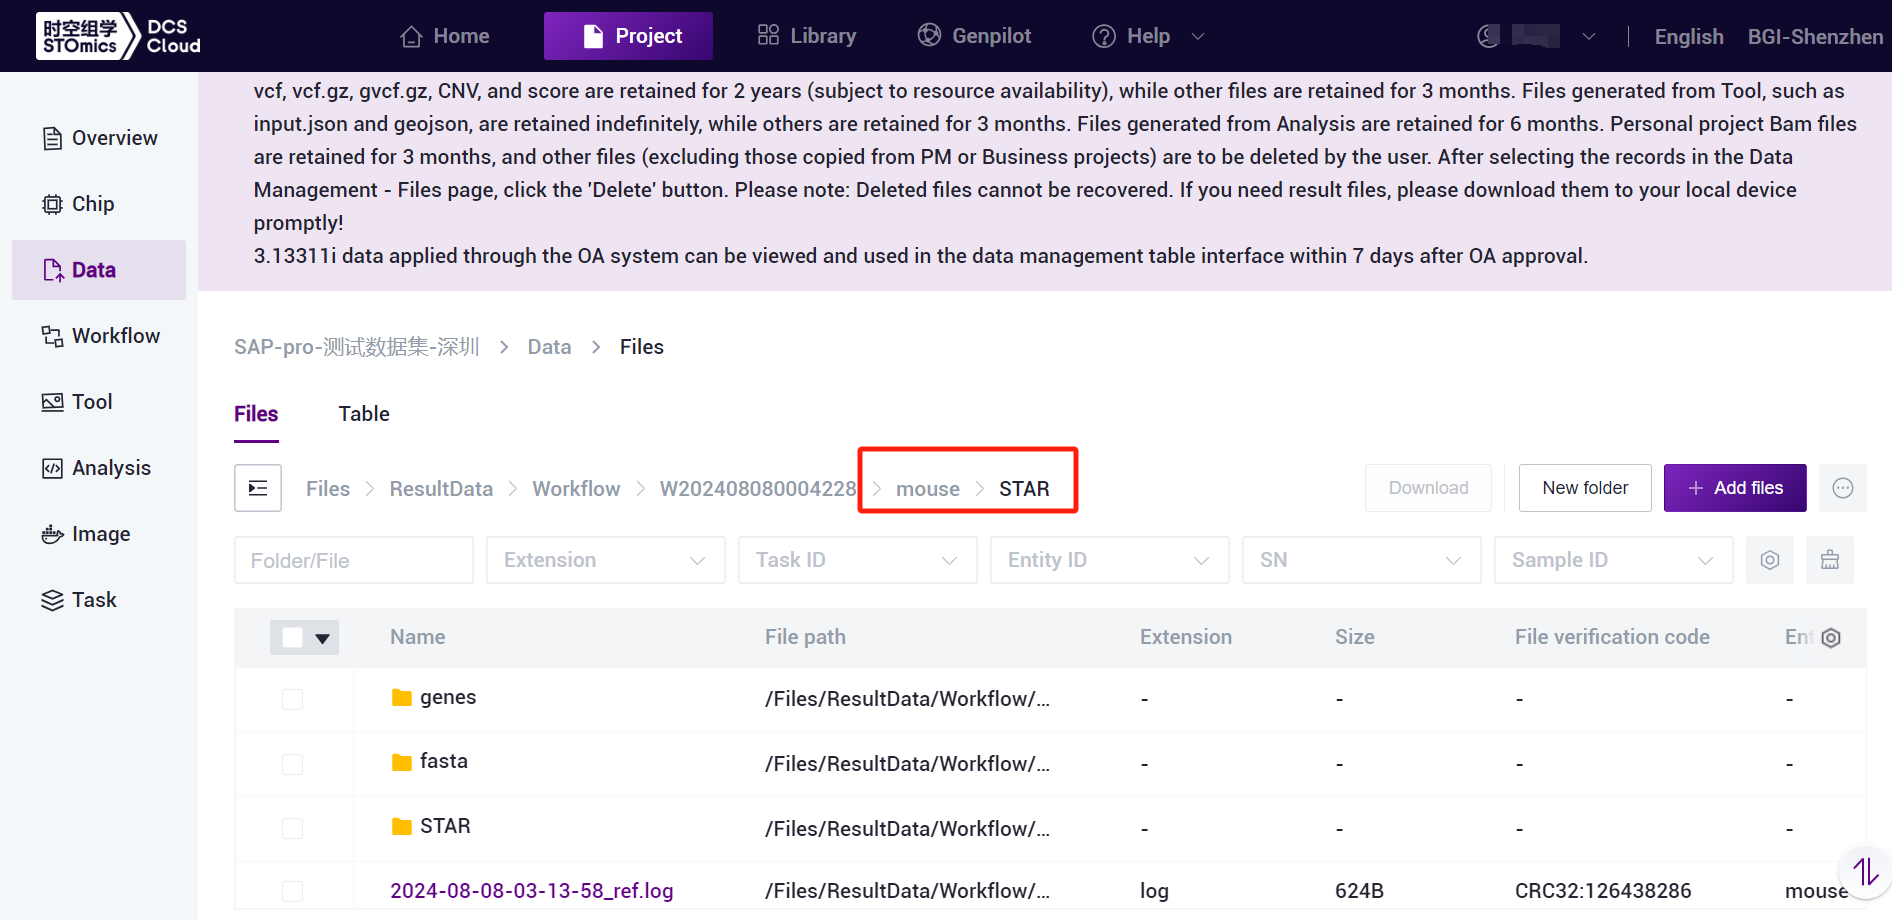
The SAW-ST-V8 ReferenceIndex file is a standardized directory structure with subfolders containing genes, STAR, and fasta [Figure 3-1]. For transcriptomics analysis, ReferenceIndex parameter is only used to fill in the index of STAR mode, if you want to start microorganisms analysis, you need to fill in multiple indexes including STAR/Bowtie2/Kraken2, and the process will automatically start the microorganisms analysis.
3.1.1 Public data
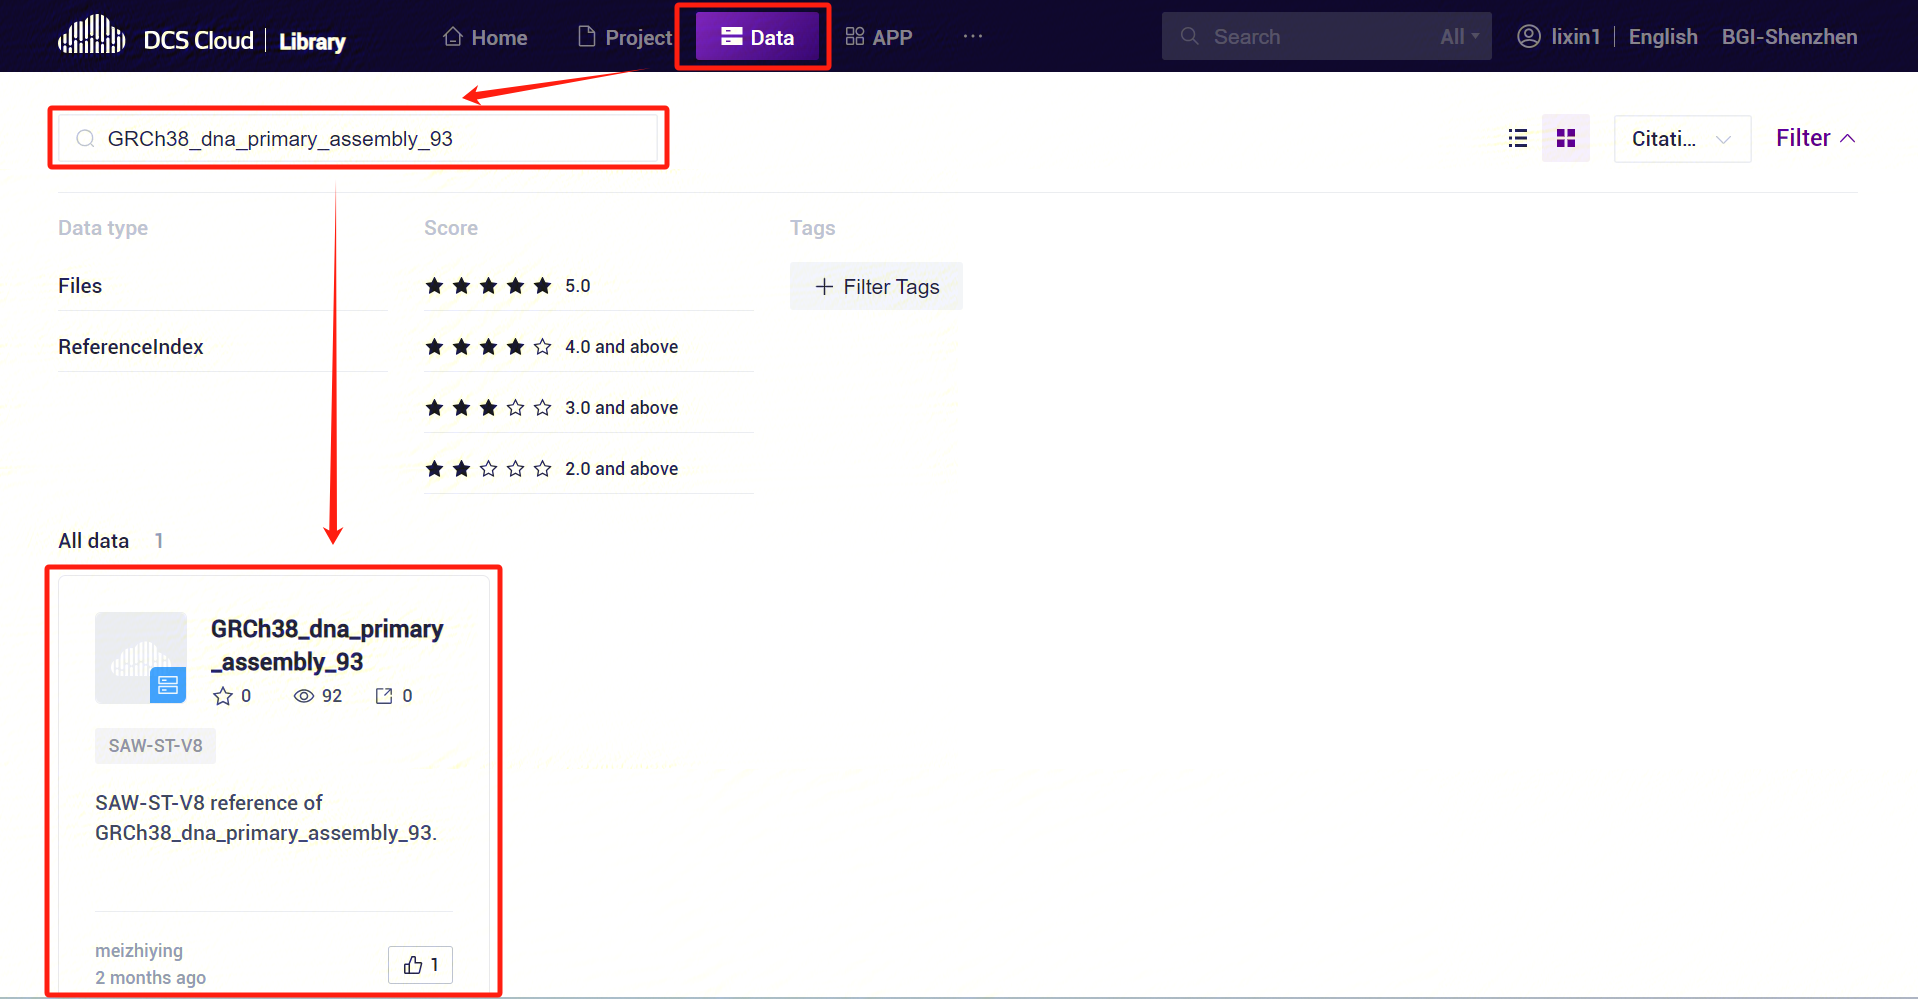
The human and mouse ReferenceIndex has been released to the public data, click [Library]-[Data], search for GRCh38_dna_primary_assembly_93 and mouse can be queried to the relevant data [Figure 3-2].
3.1.2 SAW-ST-V8-makeRef
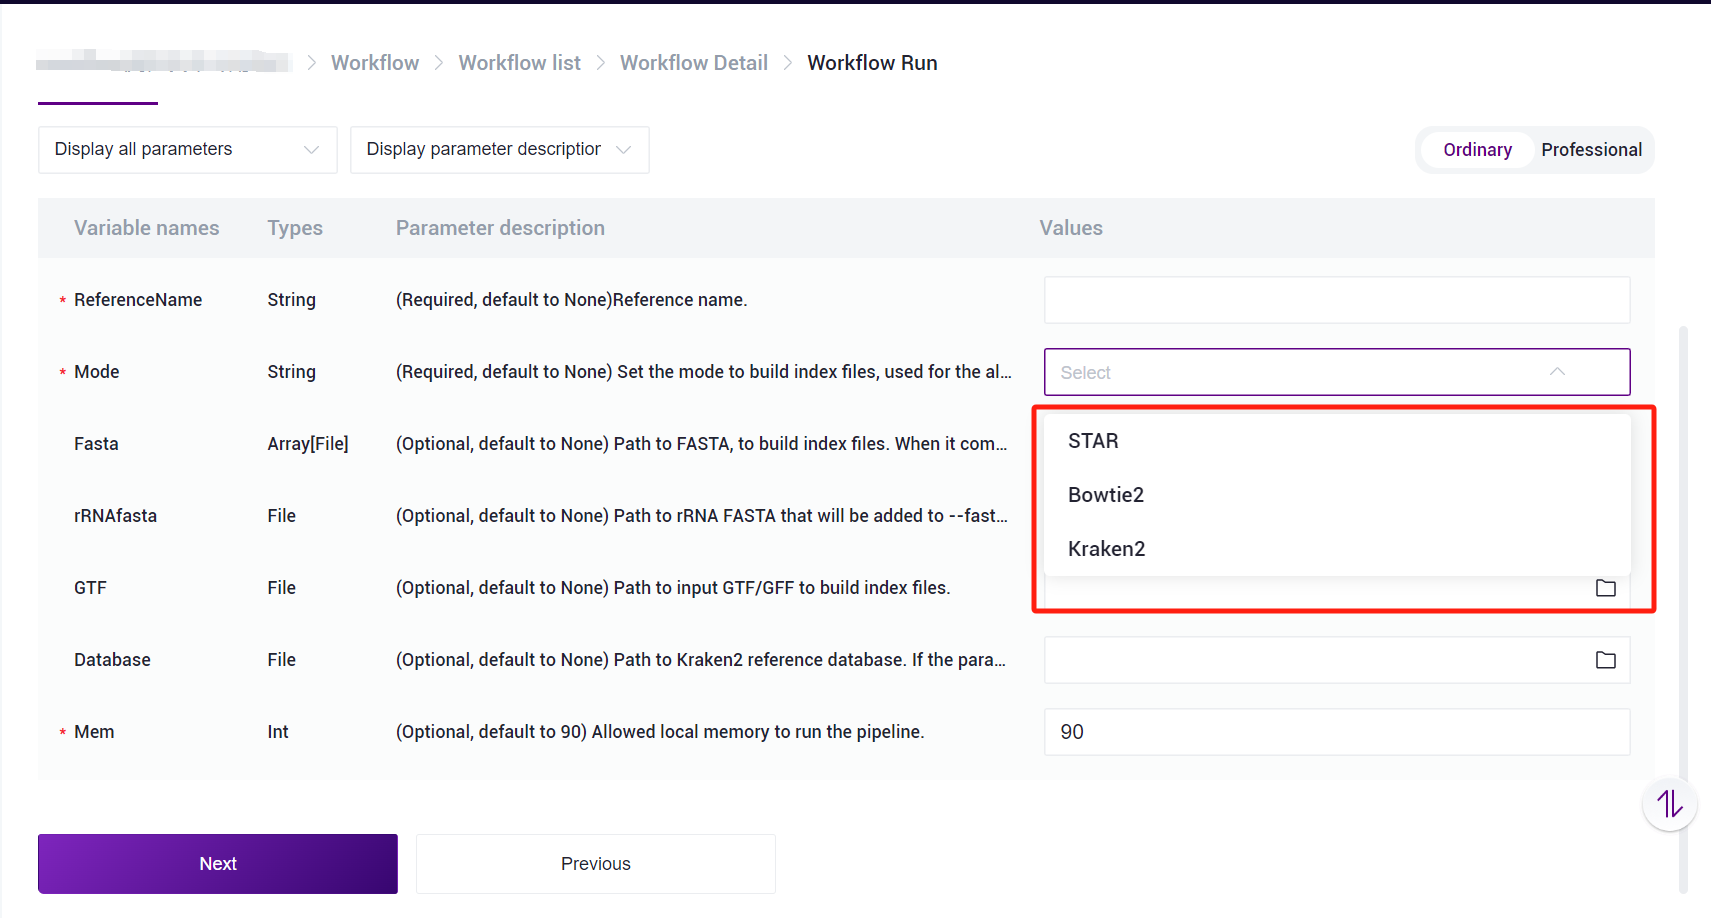
Other species can also use the SAW-ST-V8-makeRef process to build the ReferenceIndex file, and there are three main modes of operation, STAR/Bowtie2/Kraken2 [Figure 3-3], with the process running as follows:
STAR mode:
ReferenceNameis user-defined reference name,Modeparameter selects STAR, in STAR mode,FastaandGTFparameters are required,rRNAfastaparameter is optional,Databaseparameter is not required,Memparameter can be defined according to the need to run.Bowtie2 mode:
ReferenceNameis user-defined reference name,Modeparameter selects Bowtie2, just full in theFastaparameter, andMemparameter can be defined according to the need to run.Kraken2 mode:
ReferenceNameis user-defined reference name,Modeparameter selects Kraken2, user need to fill in theFastaparameter andDatabaseparameter, Database is Kraken2 database, which need to be provided by the user,Memparameter can be defined according to the need to run.
SAW-ST-V8-makeRef generates a ReferenceName named folder [Figure 3-4], the folder contains Mode named sub-folders, easy to differentiate and traceback, sub-folders under the ReferenceIndex dependent files, in the run of the SAW-ST-V8 main process, the ReferenceIndex should be selected to the level of the Mode folder.
3.2 Usage Scenario 1: Manual Submission
The SAW-ST-V8 process mainly runs the count step. After running the task, when the status of the task is completed, it means the task has been completed and you can view the report.
3.2.1 Step One: Upload data
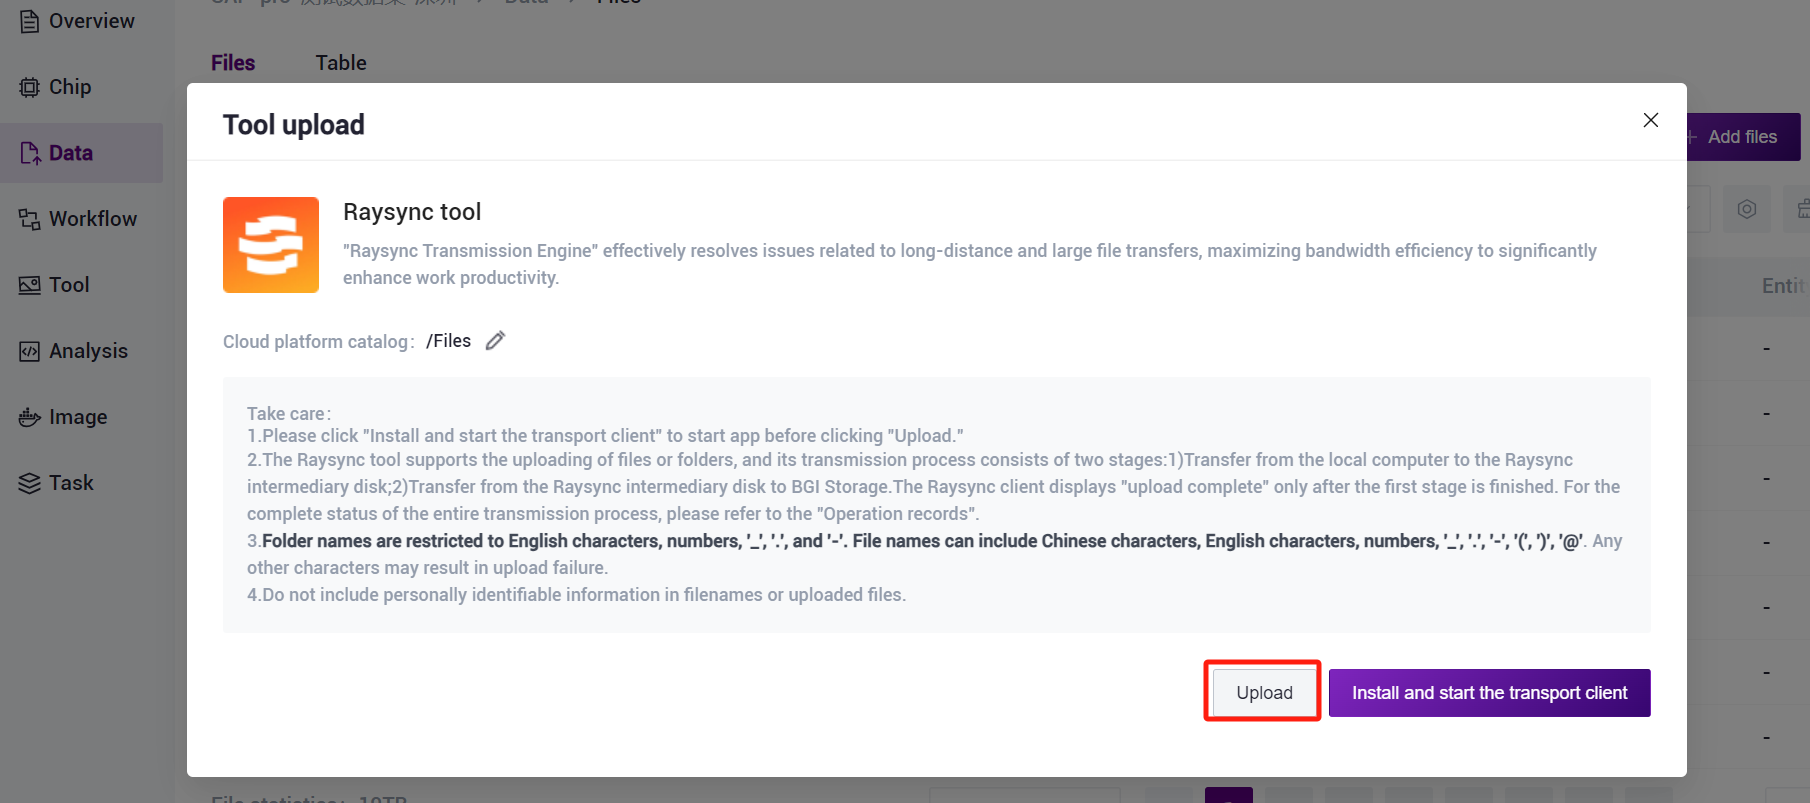
- Click on the left navigation bar [Data], enter the data management page, enter the target folder, click on the upper right corner of the [+ Add files] - [Tool upload] to upload data (Figure 3-5).

- Click [Upload] to browse and select the desired file (Figure 3-6), and the file will be displayed in the destination folder after the upload is completed (if it is the first time to upload, you need to click [Install and start the transport client] to install the required tools).
3.2.2 Step Two: Add the workflow
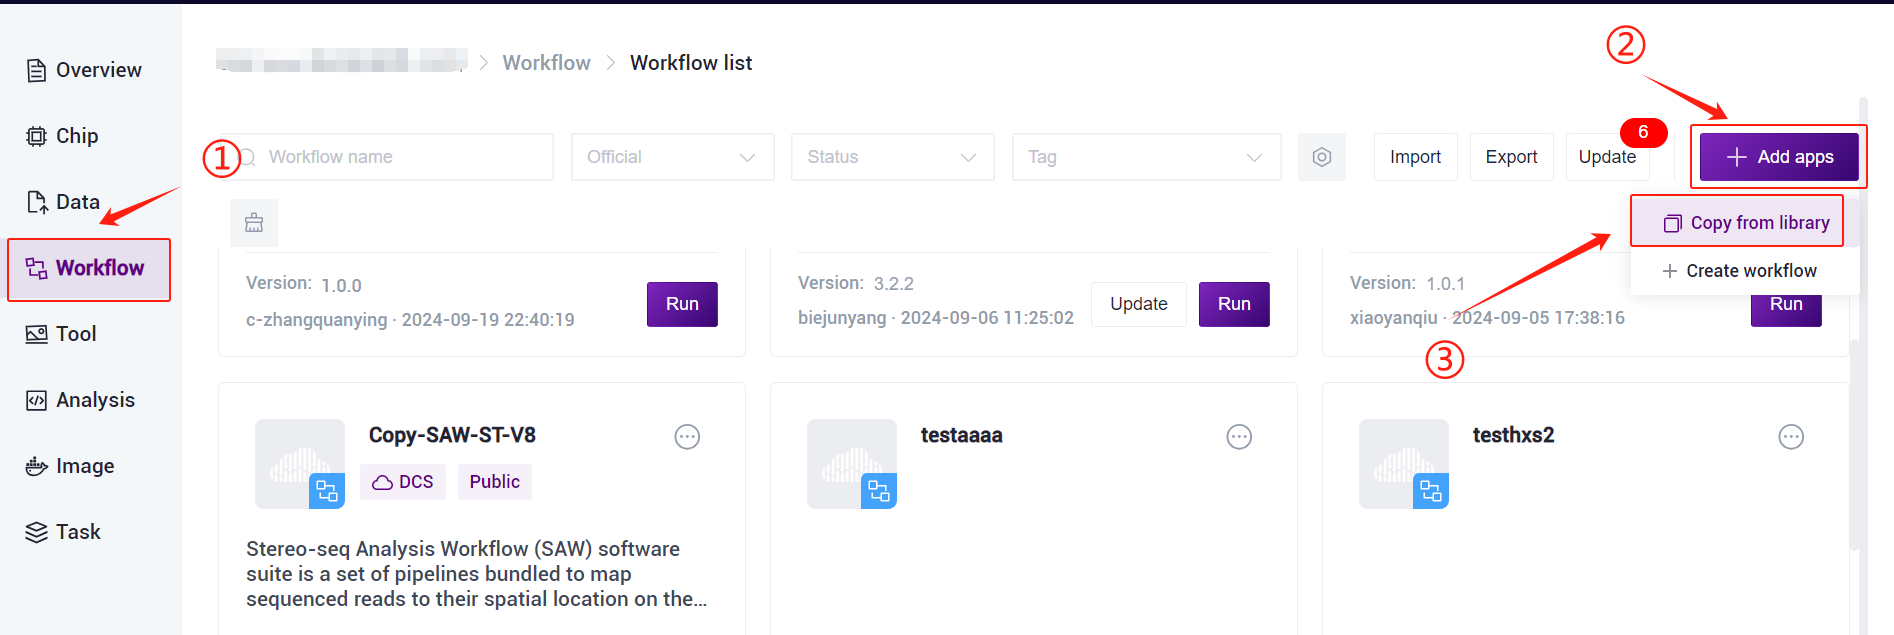
- Click the left navigation bar [Workflow] to enter the process analysis page, click the upper right corner of the [+ Add apps] to add workflow, click [Copy from library] (Figure 3-7).
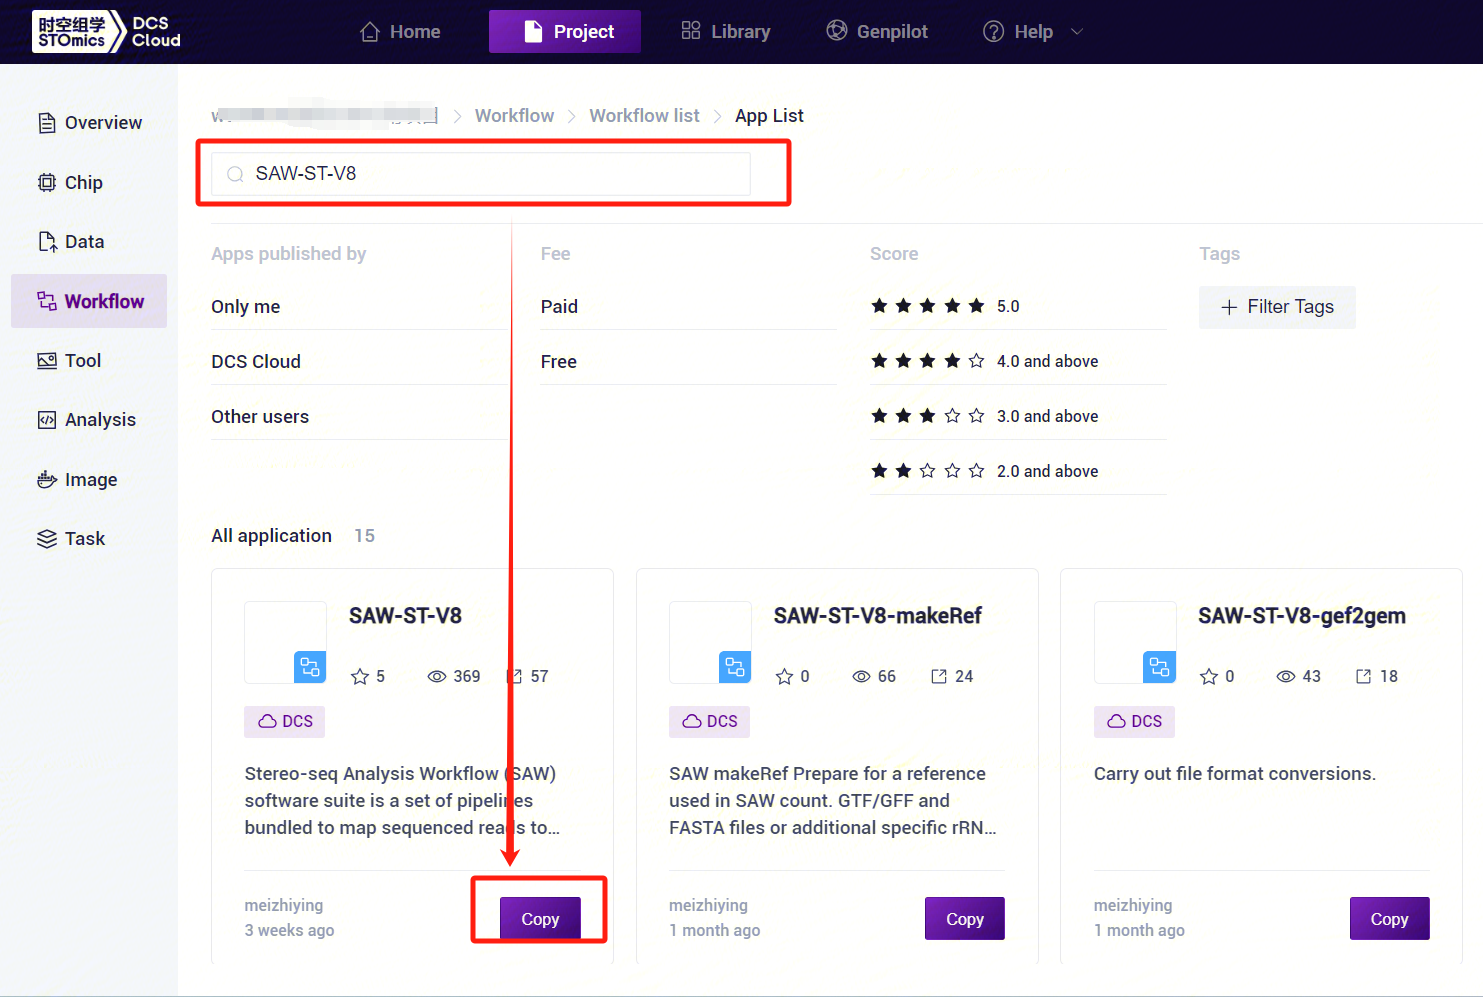
- Enter SAW-ST-V8 in the search box, click [Copy], and add it to your personal project [Figure 3-8].
3.2.2 Step Three: SAW-ST-V8 analysis
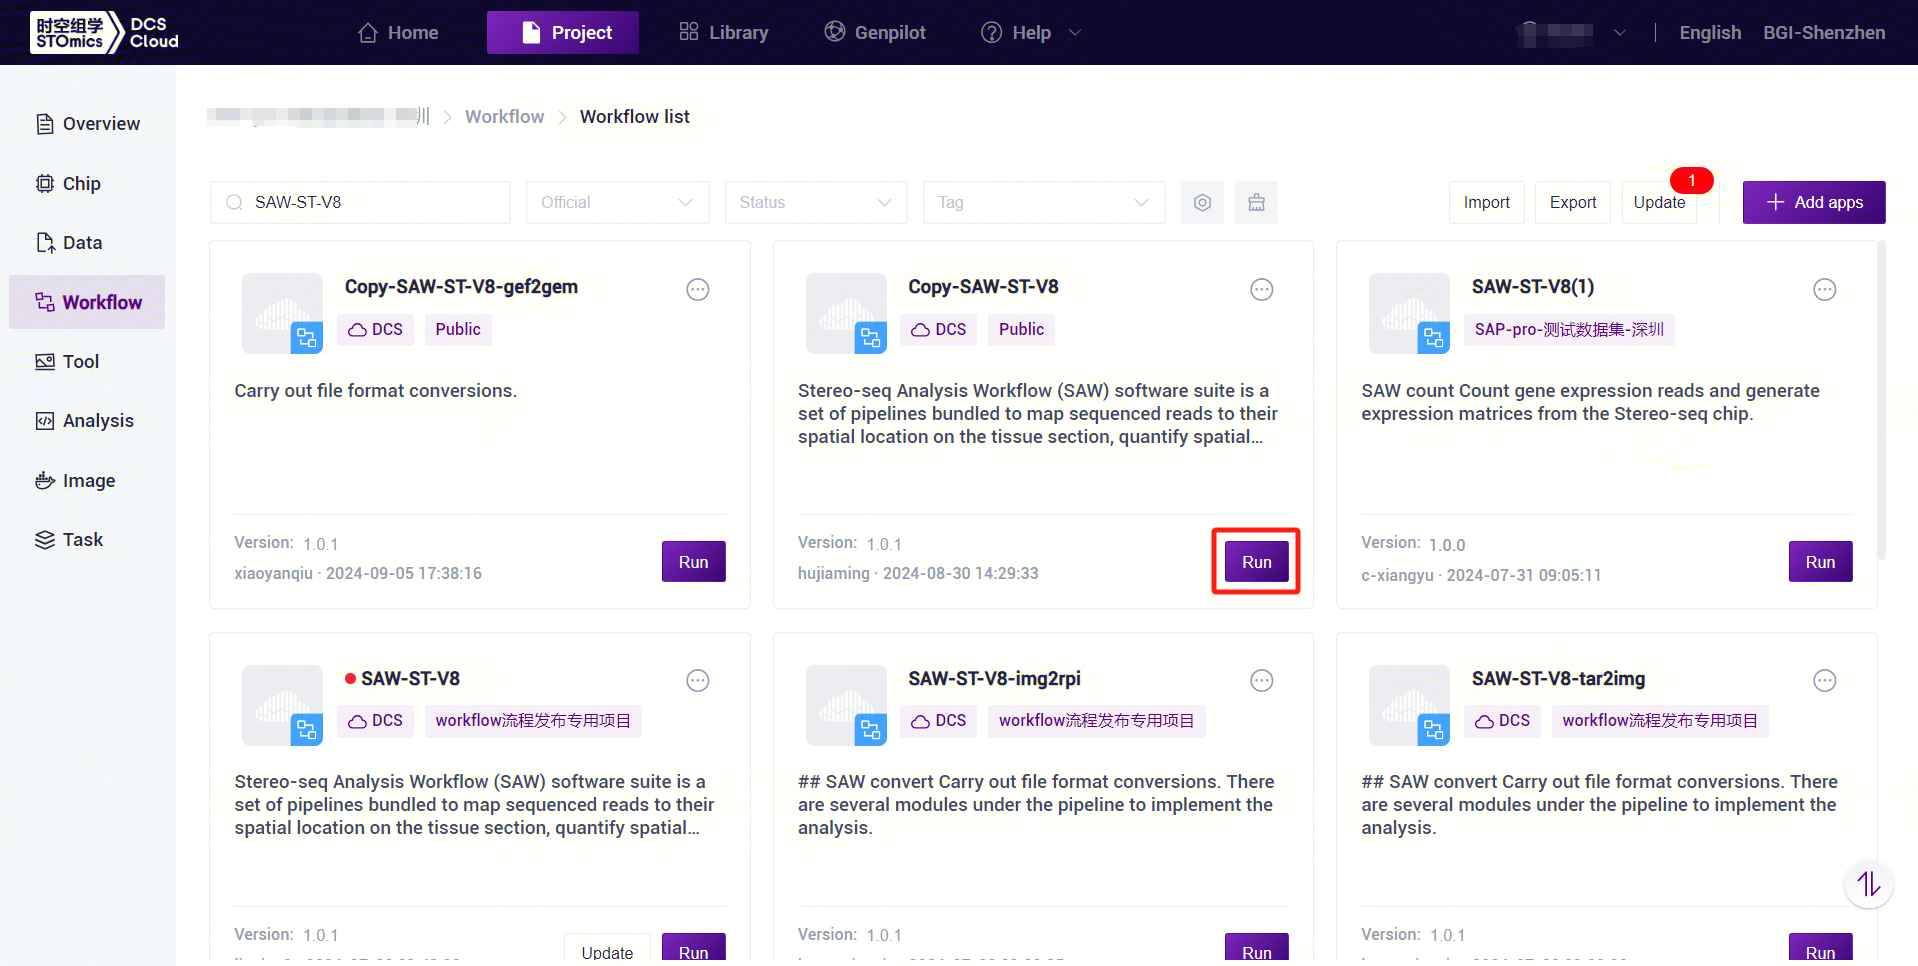
- Click the left navigation bar [Workflow] to enter the process analysis page, enter SAW-ST-V8 in the search box, click [Run] (Figure 3-9).
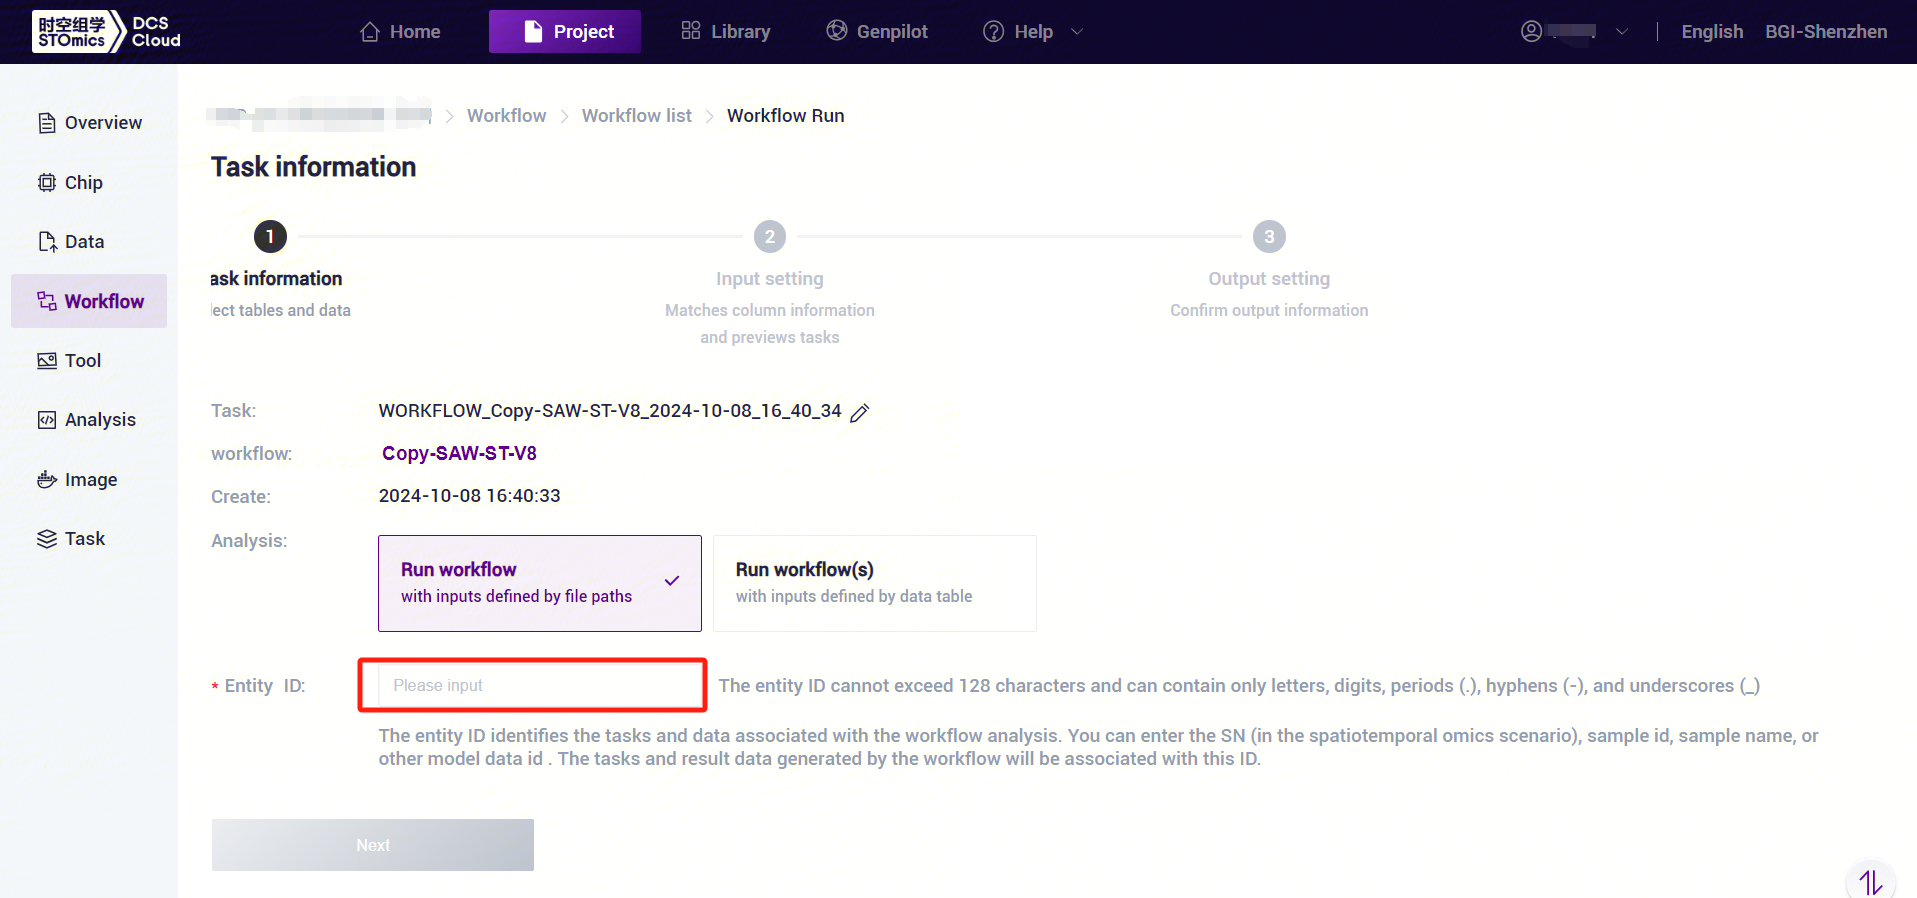
- Enter the entity ID and click [Next] (Figure 3-10).
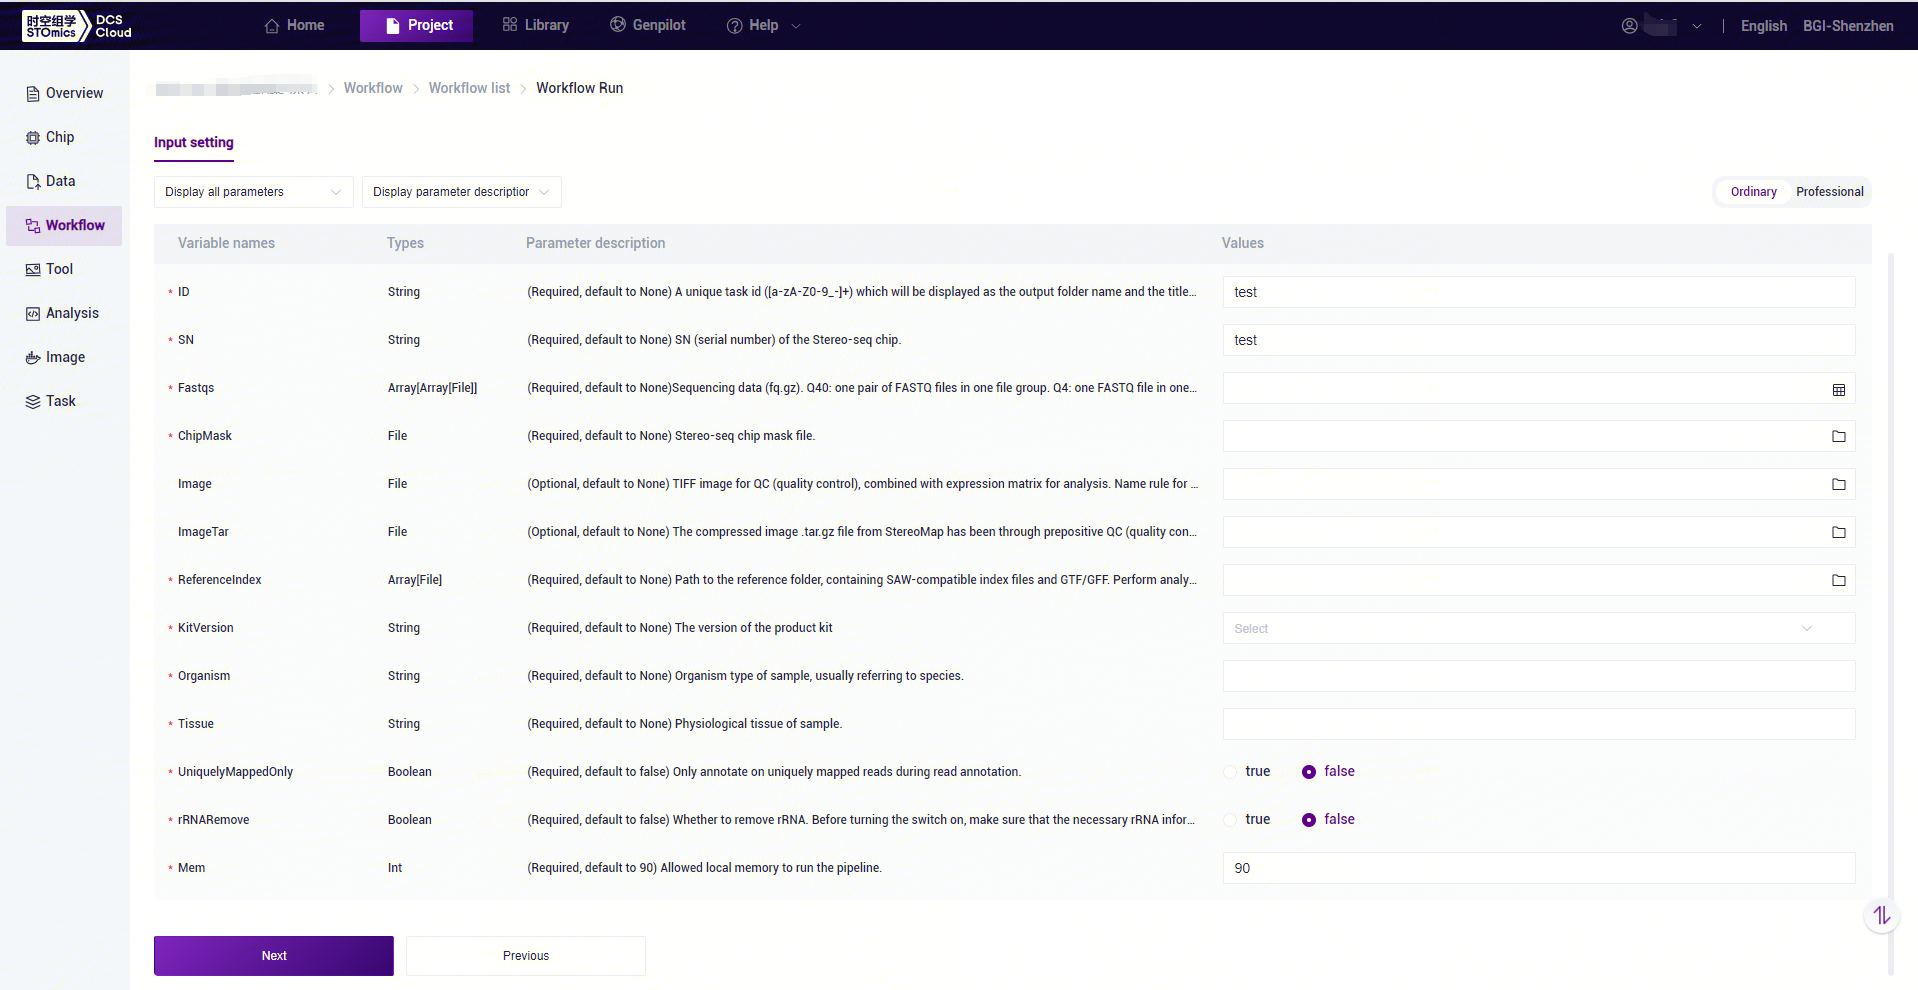
- SAW-ST_V8 to enter the sample information, then click [Next] (Figure 3-11).
Note
SAW-ST-V8 Analysis Variables Description:
ID: sample name or special ID, default is the same as Entity ID.
SN: serial number of the Stereo-seq chip, which should be the same as the chip number corresponding to the Stereo-seq data of the input parameter.
Fastqs: Sequencing raw data, Q40: PE data, one pair of FASTQ files in one file group, if there are more than one pair of FASTQ, into more than one file group; Q4: SE data, one FASTQ file in one file group , if there are more than one FASTQ, into more than one file group.
ChipMask: Stereo-seq chip mask file.
Image: the original TIFF file used for Image QC, this parameter is mutually exclusive with
ImageTarparameter, ifImageis filled in, the process will carry out Image QC and then do matrix image correlation analysis.ImgaeTar: image data for successful QC using StereoMap (version:
=4.0), this parameter is mutually exclusive with theImage` parameter and does not support QC failed scenes.ReferenceIndex: reference genome file, if it is transcription related, only use the index file of STAR mode, if you want to analyze microorganisms, you need to input more than one index file related to STAR/Bowtie2/Kraken2, if you input more than one set of indexes, the process will automatically judge to open the microorganisms detect analysis.
KitVersion:Kit version.
Organism: Organism type of sample, usually referring to species.
Tissue: Physiological tissue of sample.
UniquelyMappedOnly:whether the gene annotation process uses only uniquely mapped reads.
rRNARemove:whether to remove the rRNA.
Mem: peak running memory.
- Click [Run] to start the analysis (Figure 3-12).

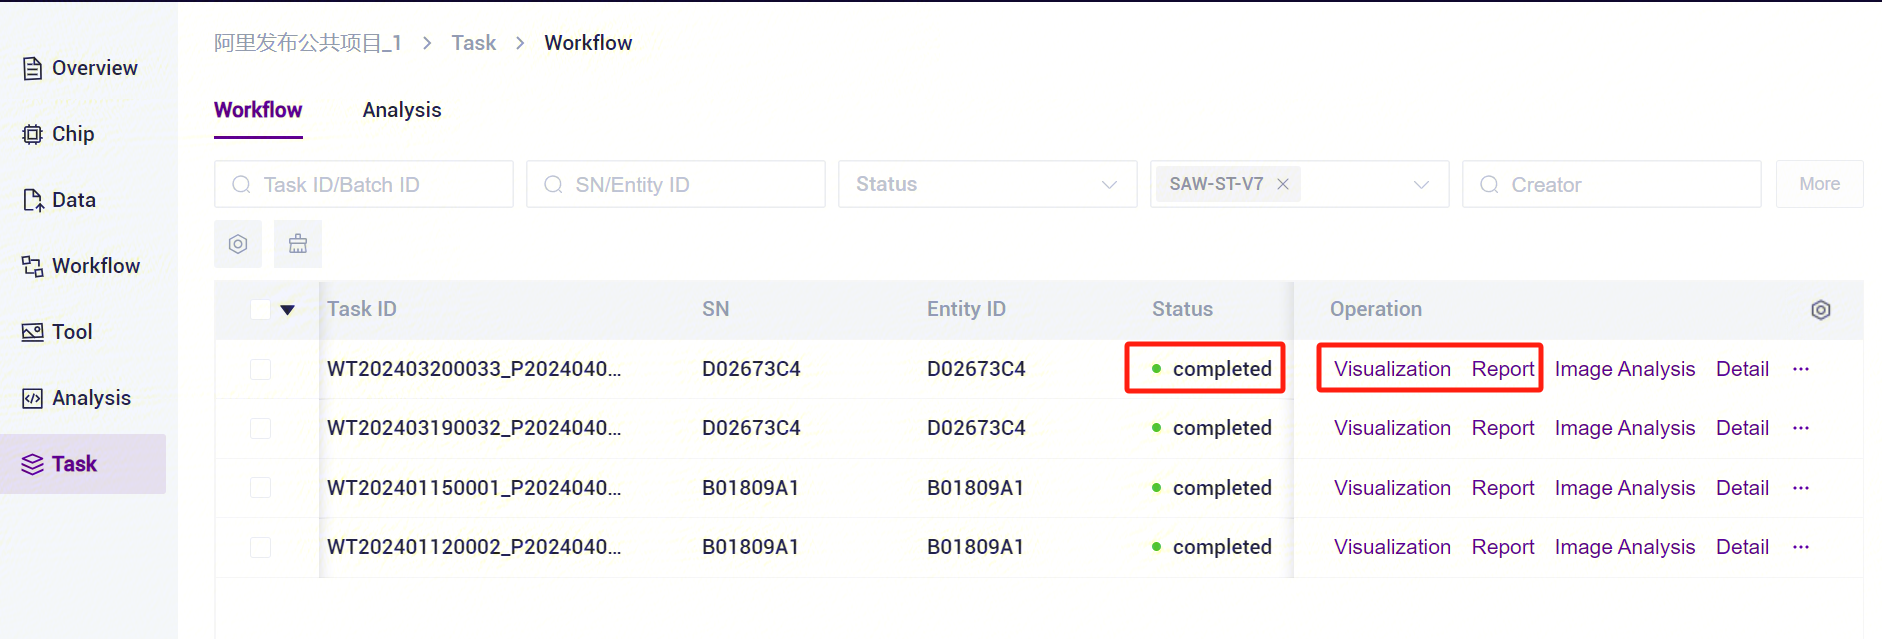
- Click the left navigation bar [Task] to enter the process analysis page, select SAW-ST-V8 in the process name to view the task status, and when the task is completed, the task status is displayed as Completed. You can view the visualization results and process report through the [Visualization] and [Report] buttons [Figure 3-13].
3.3 Usage Scenario 2: Table submission
The operation consists of five steps: uploading data, adding workflow, downloading form templates, filling out and importing tables, and starting the analysis. After completing the sample template import, you can run the task in batch, when the customer sees the task status as Completed,then you can view the report(see Part 3.4).
3.3.1 Step One: Upload data
Consistent with Step 1 of Use Scenario 1 (manual submission) (for details, see 3.2.1 Step 1: Upload data).
3.3.2 Step Two: Add the workflow
Consistent with step 2 of use scenario 1 (manual submission) (for details, see 3.2.2 Step 2: Add workflow).
3.3.3 Step Three: Download the form template
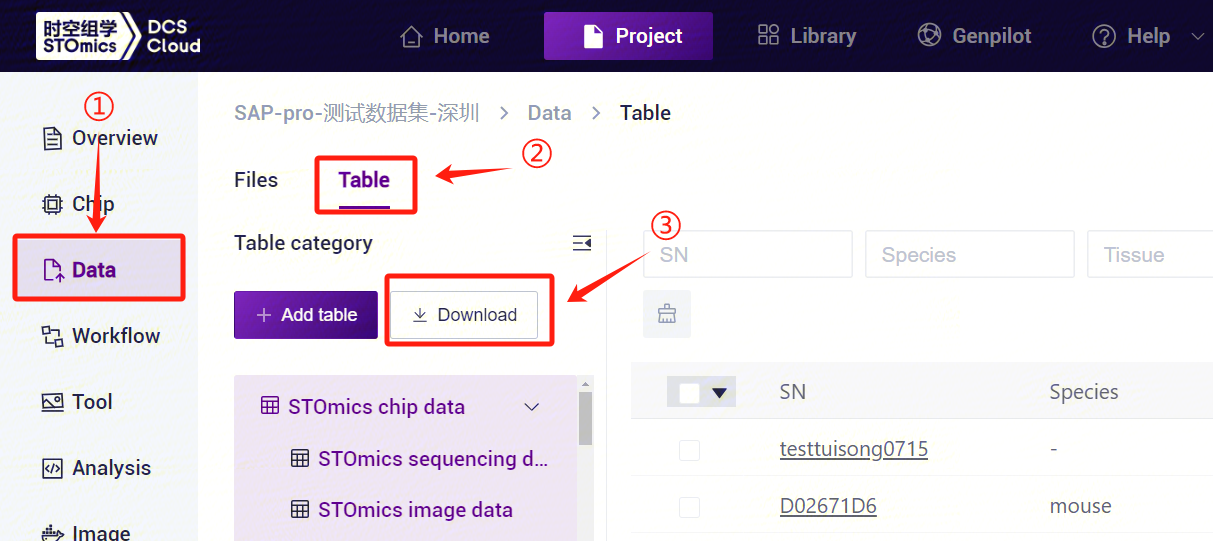
- Click the left navigation bar [Data], select [Table] - [Download] (Figure 3-14), click [Workflow template], select the SAW-ST-V8 template to download.
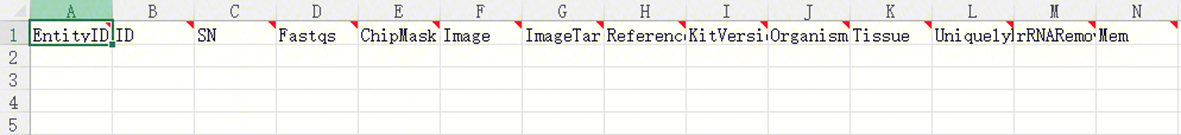
- The sample template Excel opens as in Figure 3-15.
- Modify the template to split Fastqs into two columns, Fastq1 and Fastq2 [Figure 3-16].

3.3.4 Step Four: Fill out and import the table
In this scenario, a worksheet is required to import a table. This scenario means that the data of the sequenced samples can be directly analyzed after importing the table.
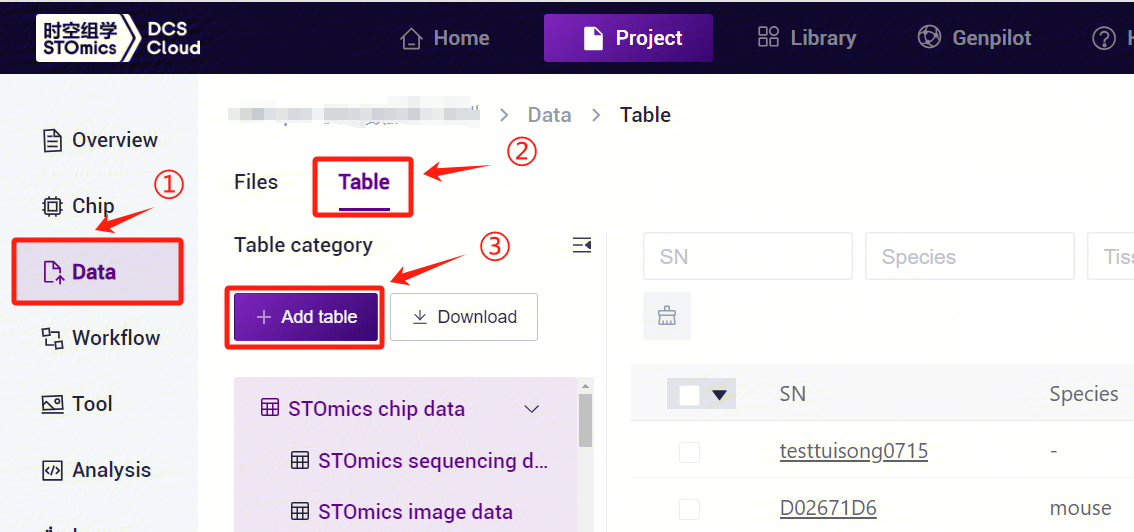
After configuring the form template, return to the [Data] interface, click [Table] - [+ Add table] (Figure 3-17).
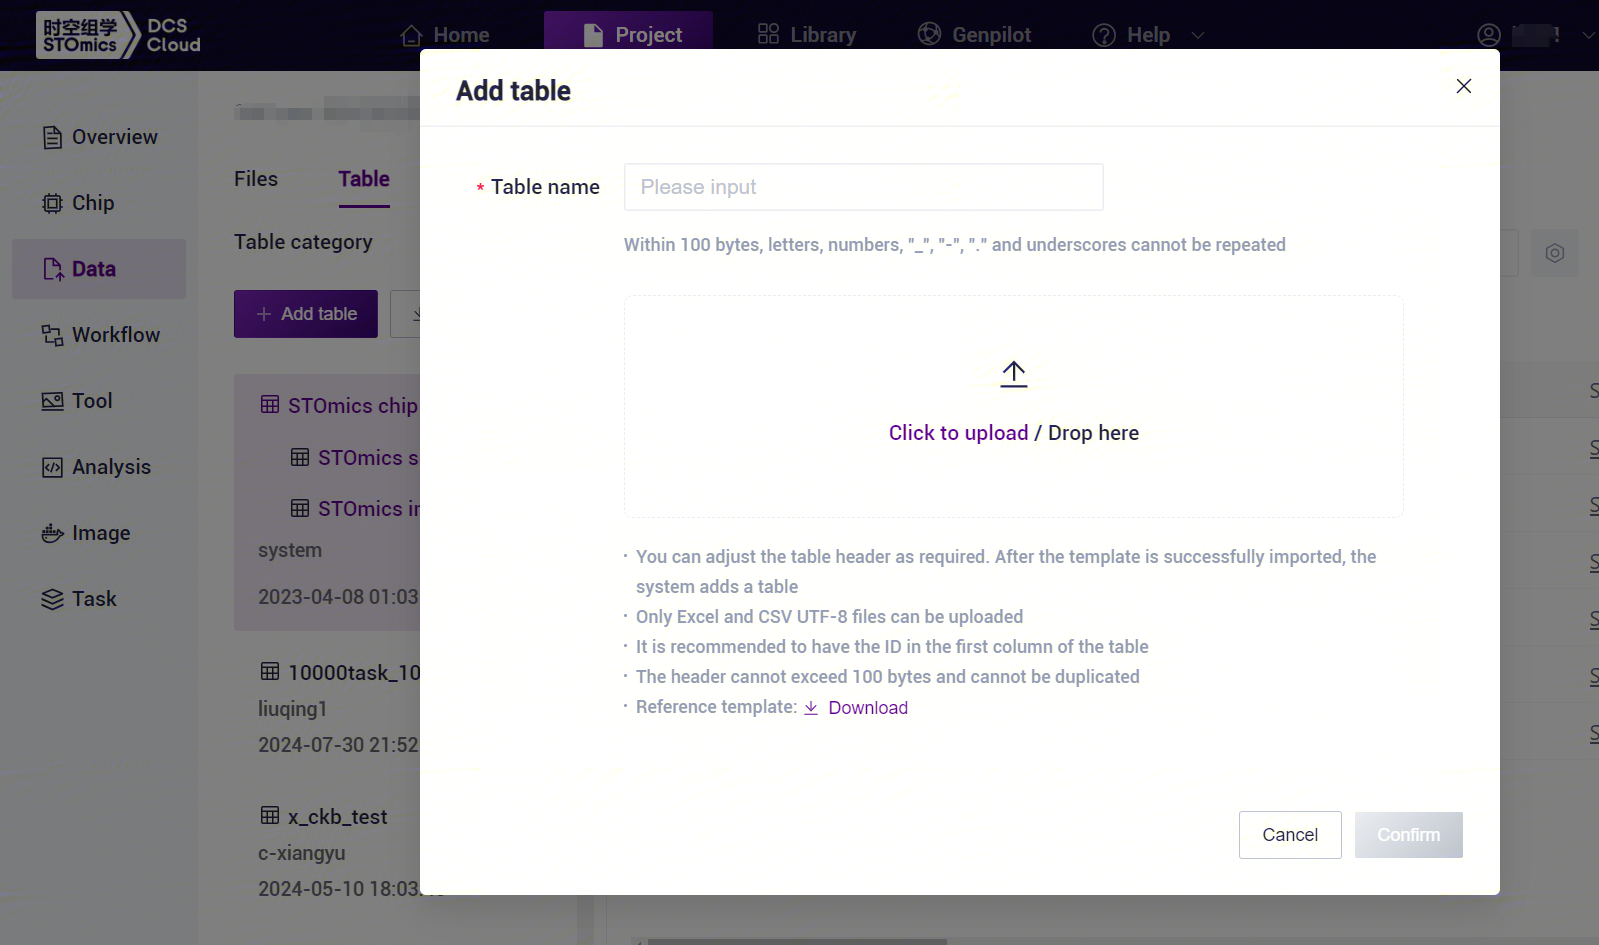
- Click [Click to upload/Drop here] to browse and select the table with the sample information filled in, click [Confirm] (Figure 3-18), after the upload is completed, the file will be displayed in the destination folder.
Click on the navigation bar [Workflow] to enter the process analysis page, enter SAW-ST_V8 in the search box, click [Run].
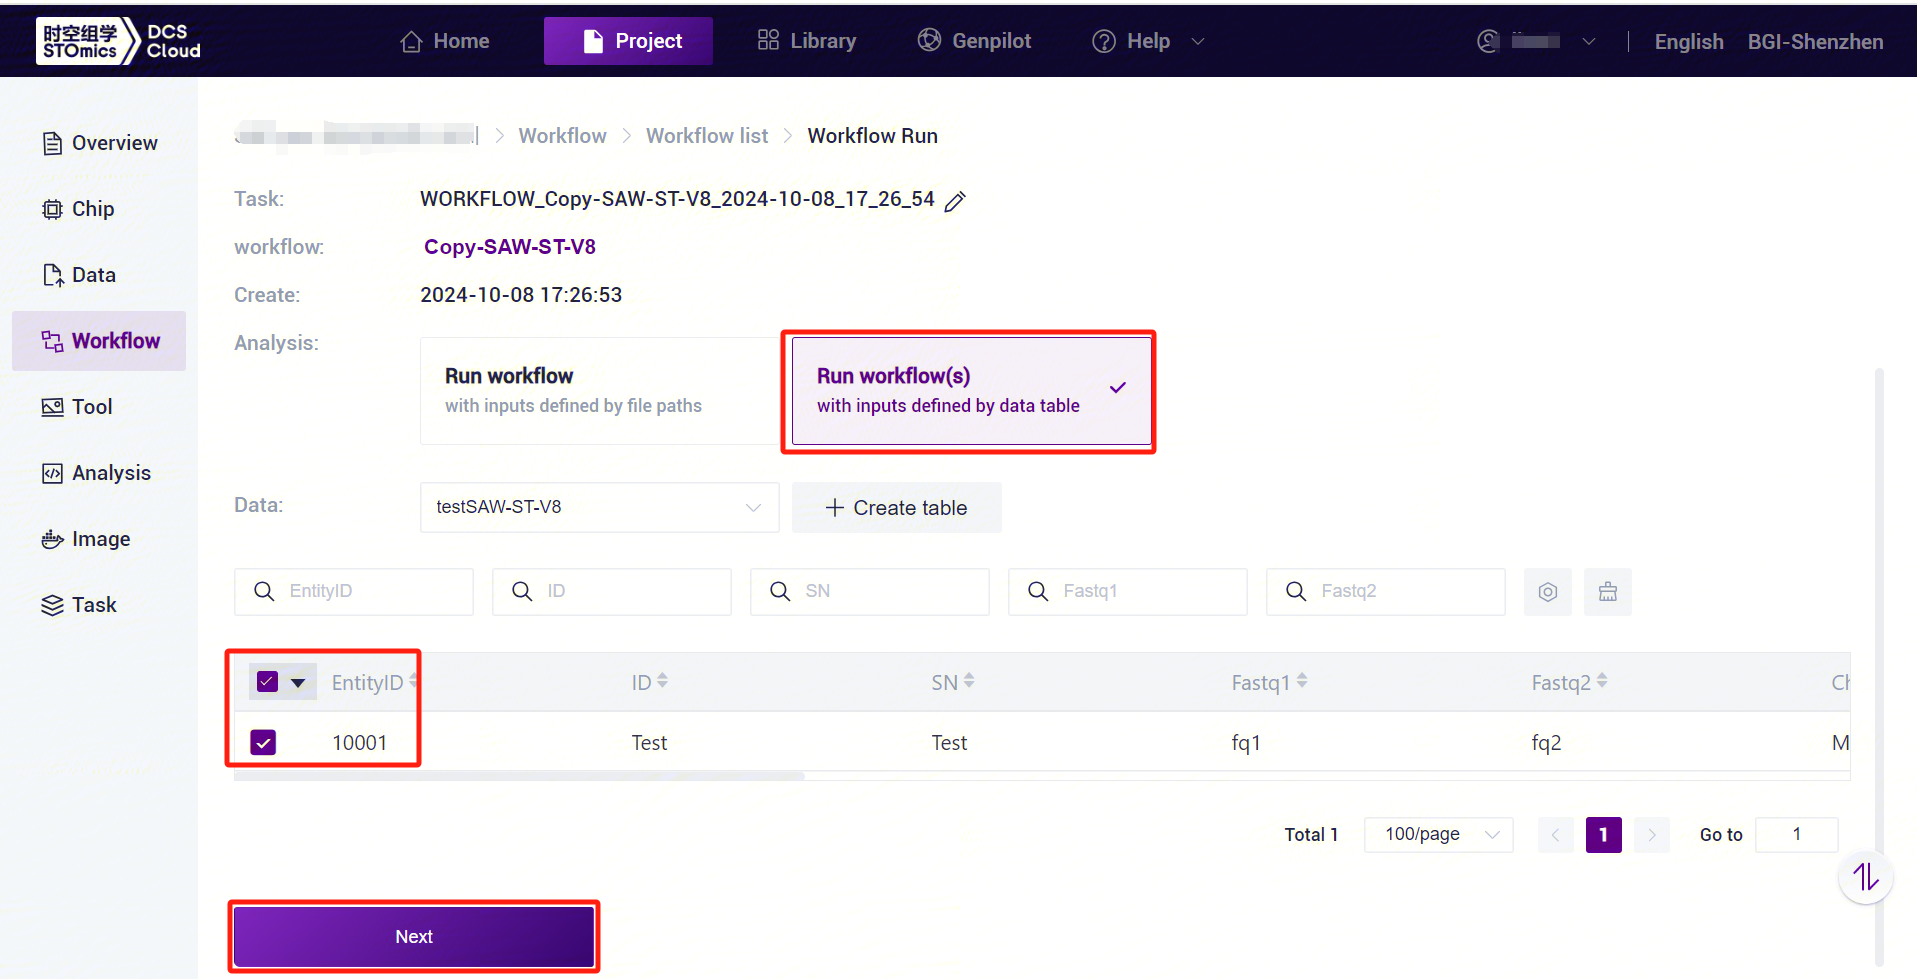
Select Run workflow(s) , select the table imported in this subsection 3, select the desired rows, and click [Next] (Figure 3-19).
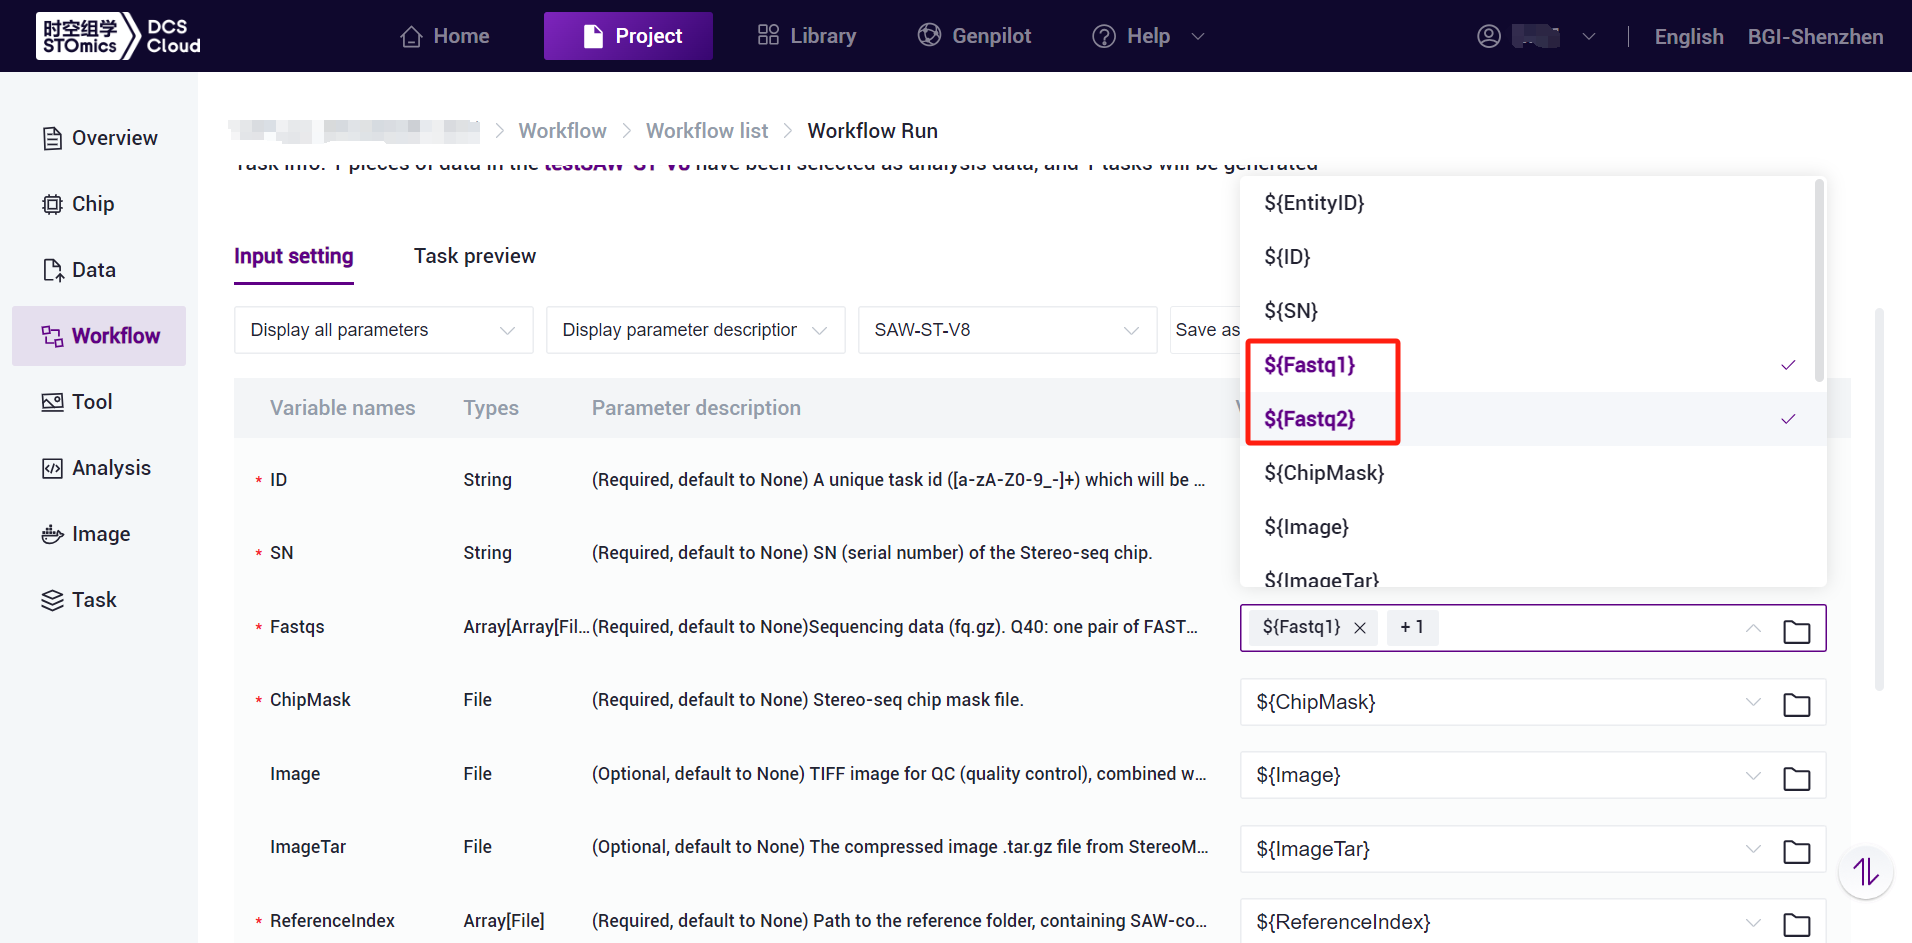
- Click and select the corresponding values, for example, {Fastq2} for Fastqs, and note that {Fastq2} should be selected sequentially (see Figure 3-20):
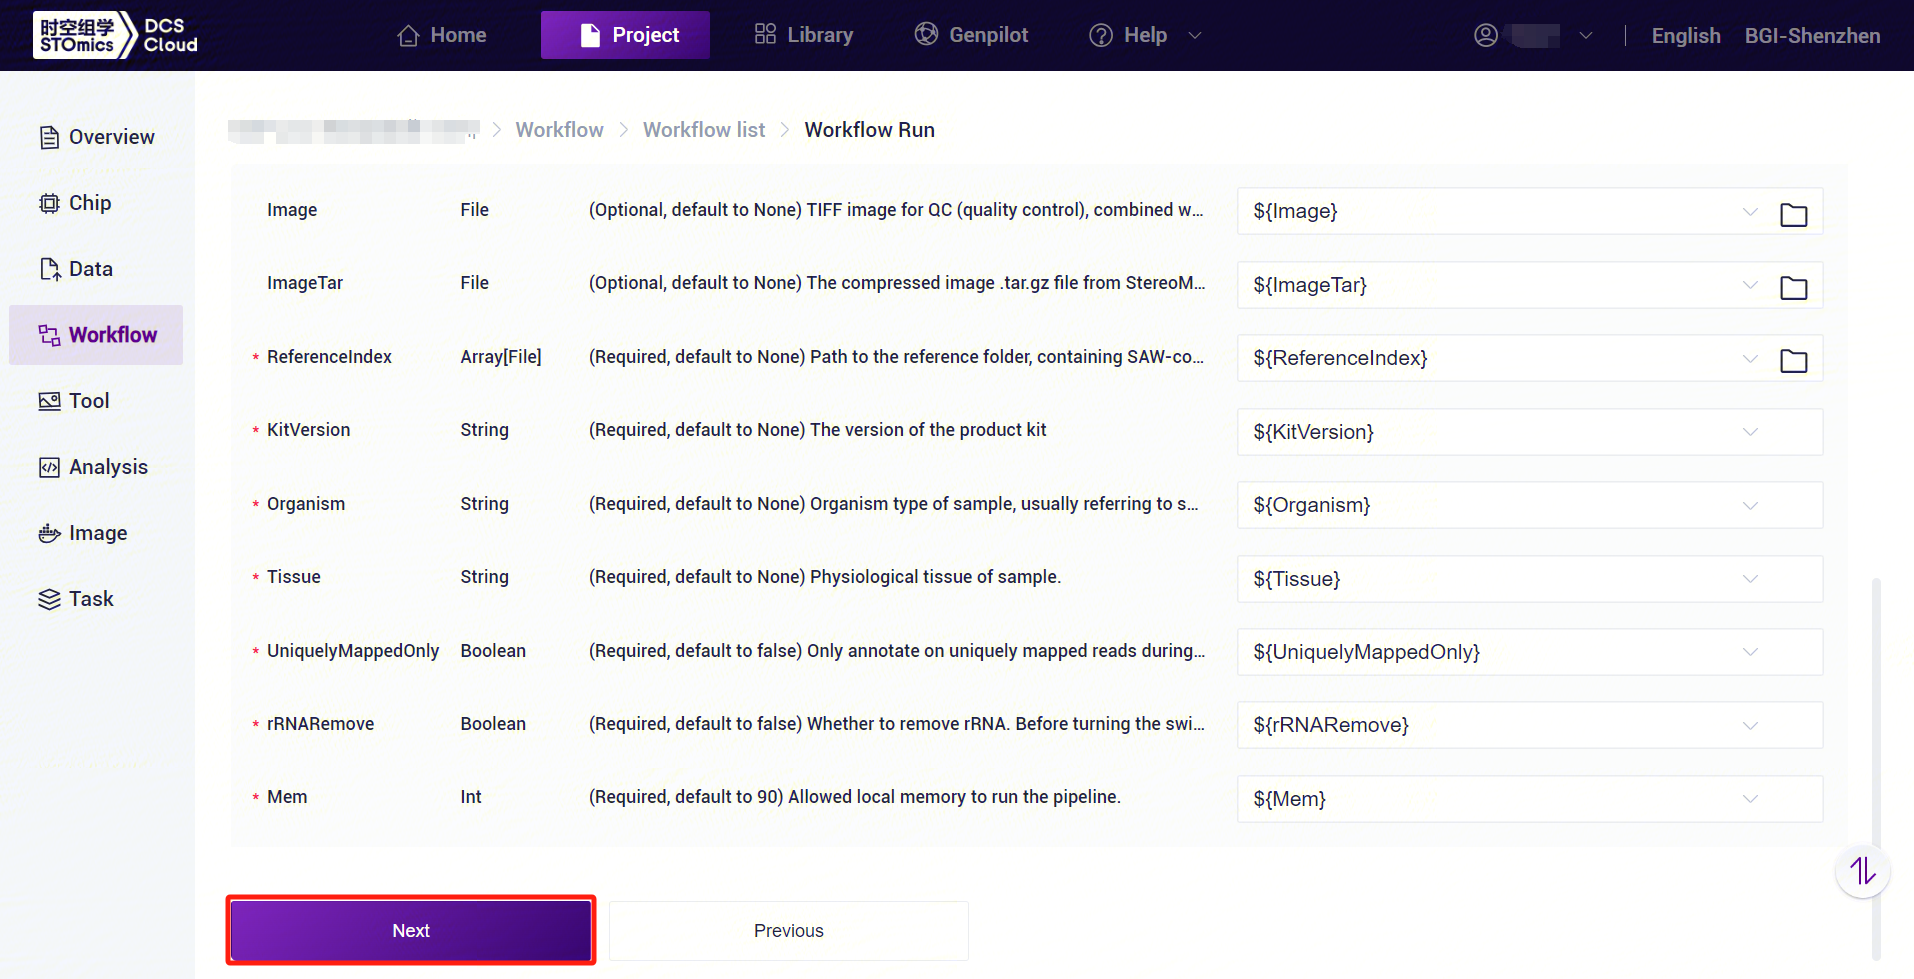
- Enter the sample information, click [Next] to ensure that the parameters are set correctly (Figure 3-21).
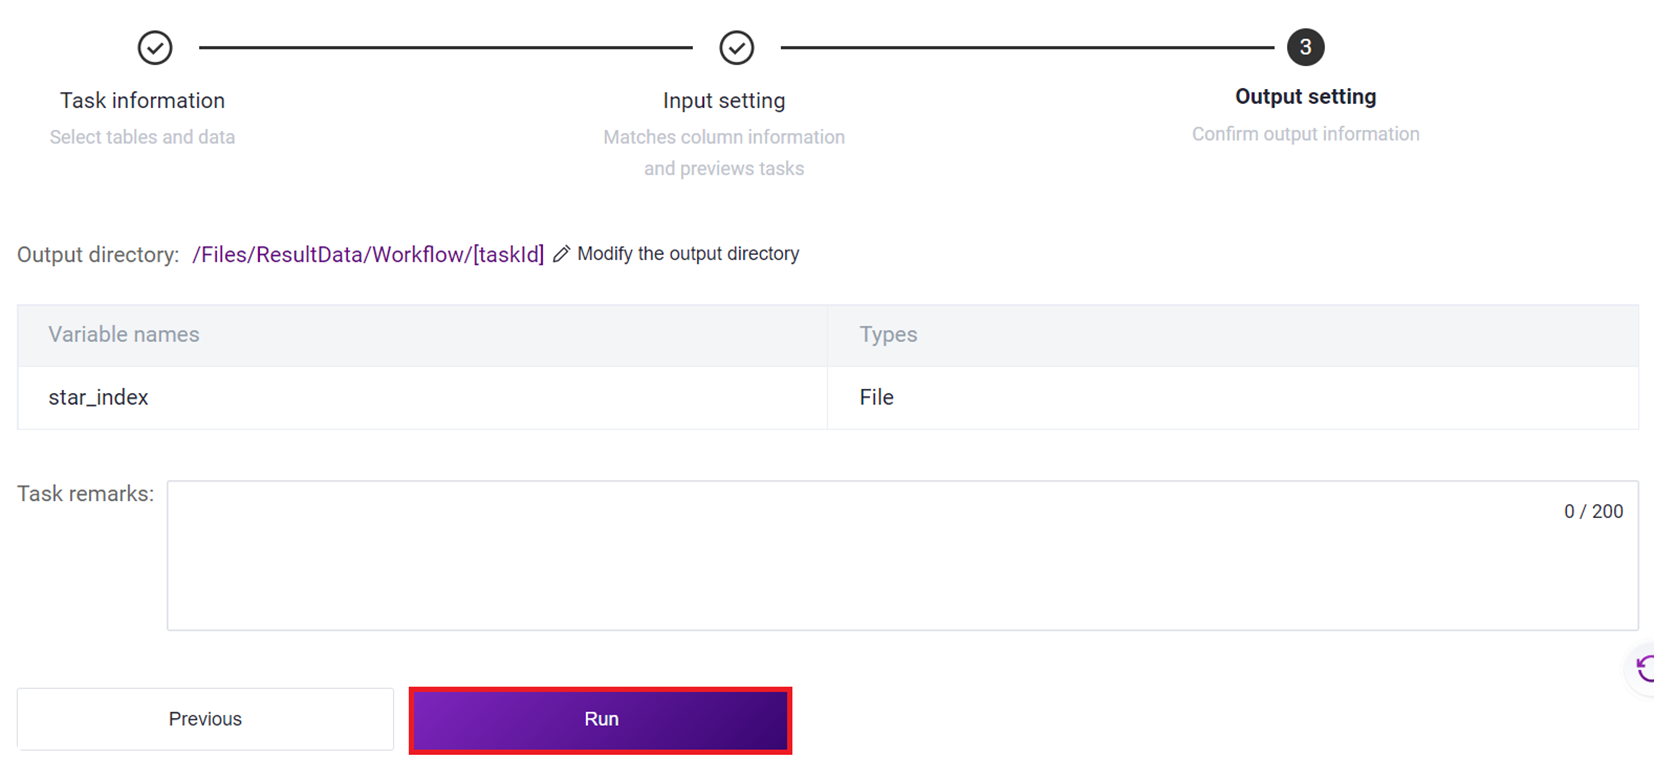
3.3.5 Step Five: Initiate the analysis
Click [Run] to start the analysis (Figure 3-22).
3.4 Report Viewing and Downloading of Resulting Documents
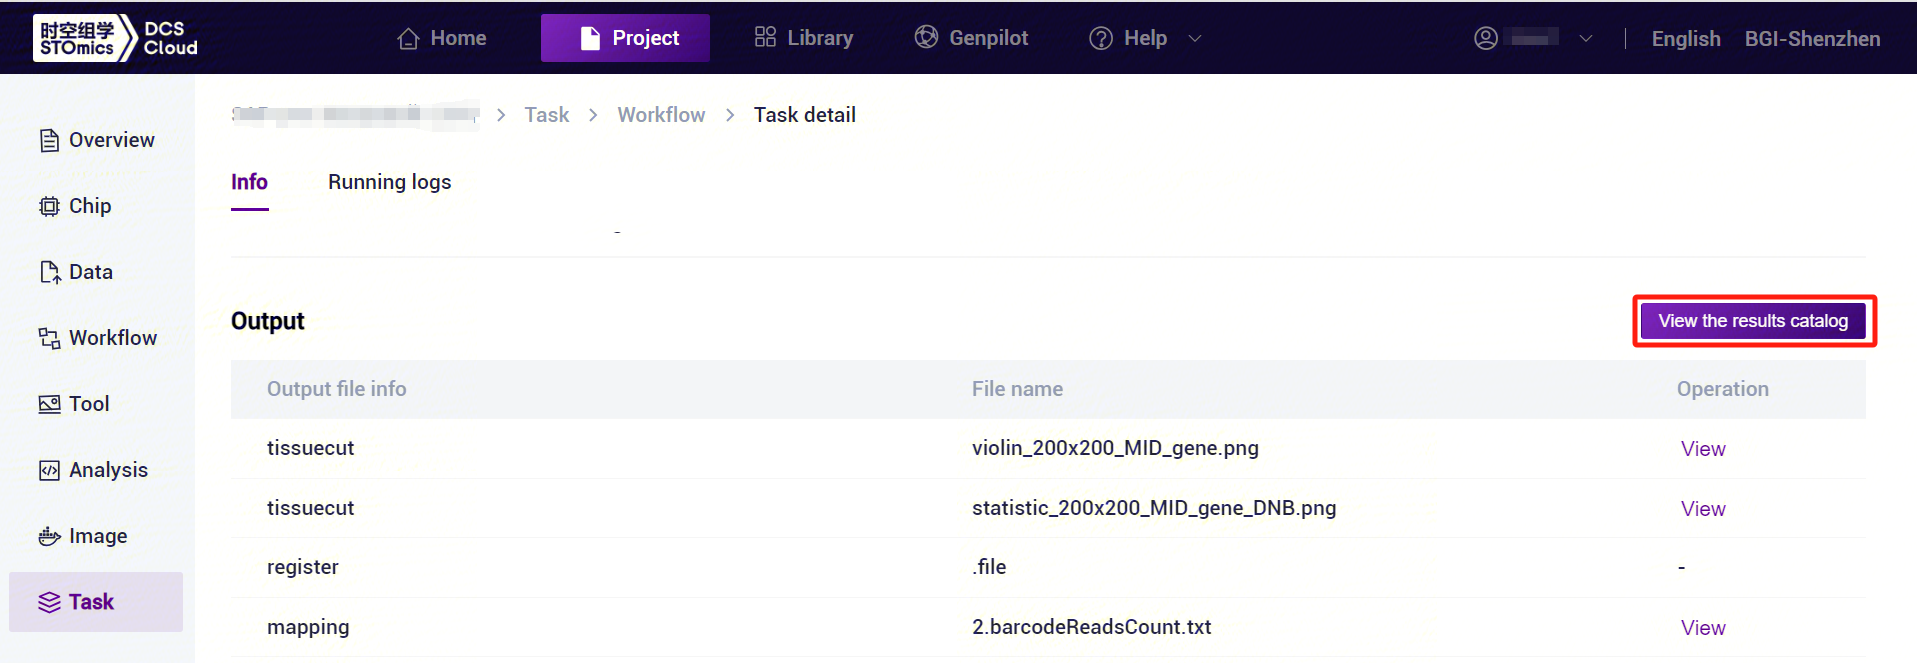
- Click the left navigation bar [Task] to enter the task management page, select SAW-ST-V8 in the process name, view the task status,when the task status is displayed as Completed, you can view the report [Figure 3-23].

- Click on the task bar [Details], you can enter the task running page, click [View the results catalog] can jump to the data management to download the results of the file (Figure 3-24).
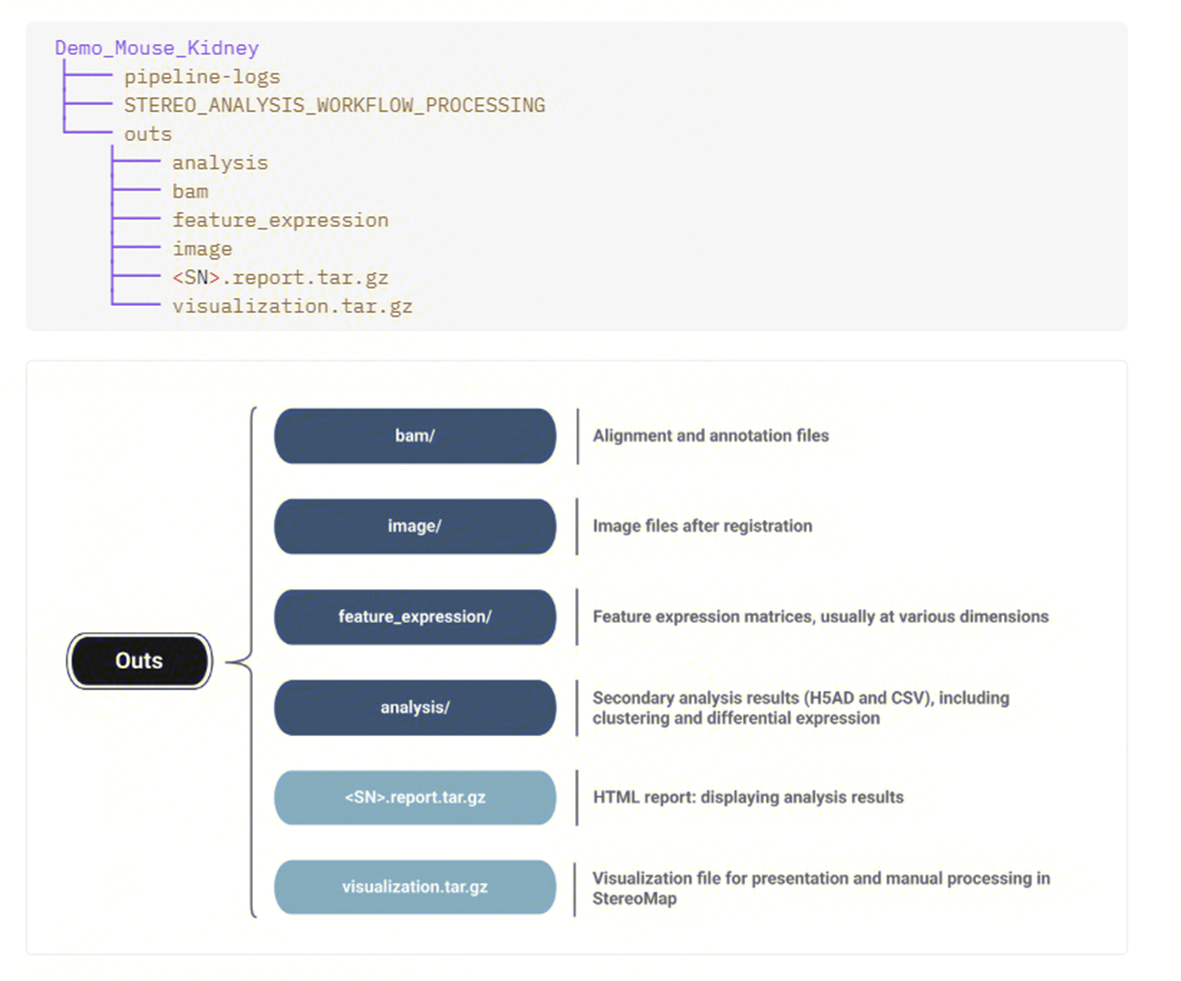
4. The output structure
All the metadata and outputs generated are listed below:
5. FAQ
- The delivered SAW task was killed by over memory, how to solve it?
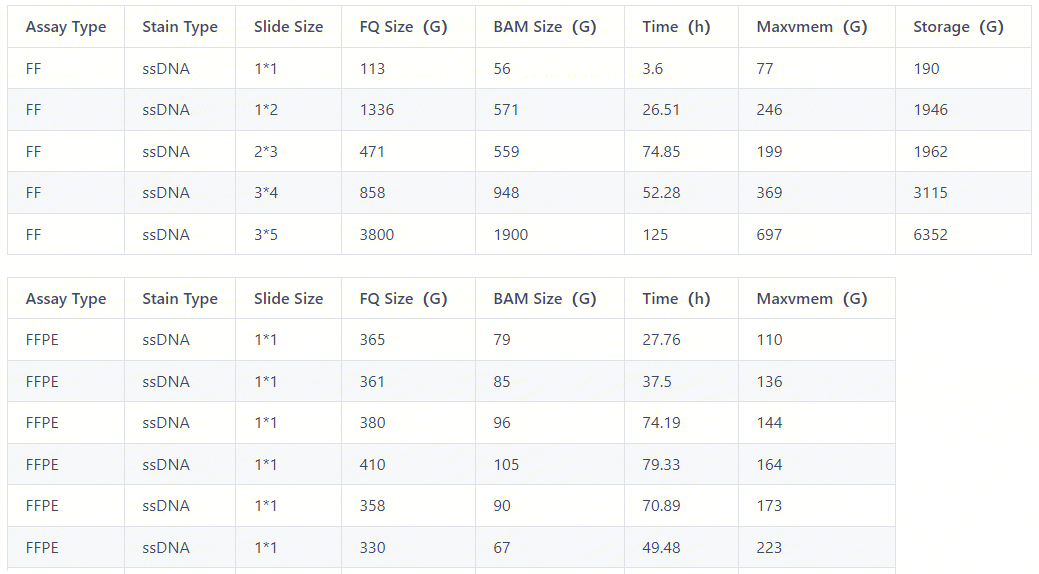
You need to modify the Mem to Re-run, because the version 8 changed the default value of UniquelyMappedOnly parameter to False, resulting in a significant increase in memory compared to V7.
You can refer to some running examples while setting the Mem. It should be noted that there are many factors affecting the memory required for a run, including slide size, FQ size, assay type, and stain type. Among them, the most influential factors are slide size and FQ size. The following example is for reference only. Please adjust the memory size according to the experimental condition.
- Is there a correspondence between SAW-ST-V8 process and visualization version?
SAW-ST-V8 is compatible with StereoMap version: `=4.0.
- What are the processes associated with SAW-ST-V8?
● SAW-ST-V8-makeRef: build reference genome index, support rRNA remove + build index;
● SAW-ST-V8-checkGTF: check GTF/GFF files to extract target information;
● SAW-ST-V8-realign: receive back manually processed data (including image TAR package and lasso GEOJSON), output HTML report;
● SAW-ST-V8-clustering, SAW-ST-V8-reanalyze-lasso, SAW-ST-V8-diffexp: performs data re-clustering, lasso, and diffexp, respectively;
● SAW-ST-V8-gef2gem, SAW-ST-V8-gem2gef, SAW-ST-V8-bin2cell, SAW-ST-V8-visualization, SAW-ST-V8-tar2img, SAW-ST-V8-img2ipr and SAW-ST-V8- merge : file format conversion tools.
- Can I use QC failed images to run SAW-ST-V8 process?
The SAW-ST-V8 process does not support QC failed image data.
- How to enable microorganisms detect?
If you want to start microorganisms analysis, you need to fill in multiple indexes including STAR/Bowtie2/Kraken2, and the process will automatically determine the microorganisms analysis.